The Sales Report presents you with your sales statistics and performance over time. It is accessible from top navigation bar menu Reports > Sales.
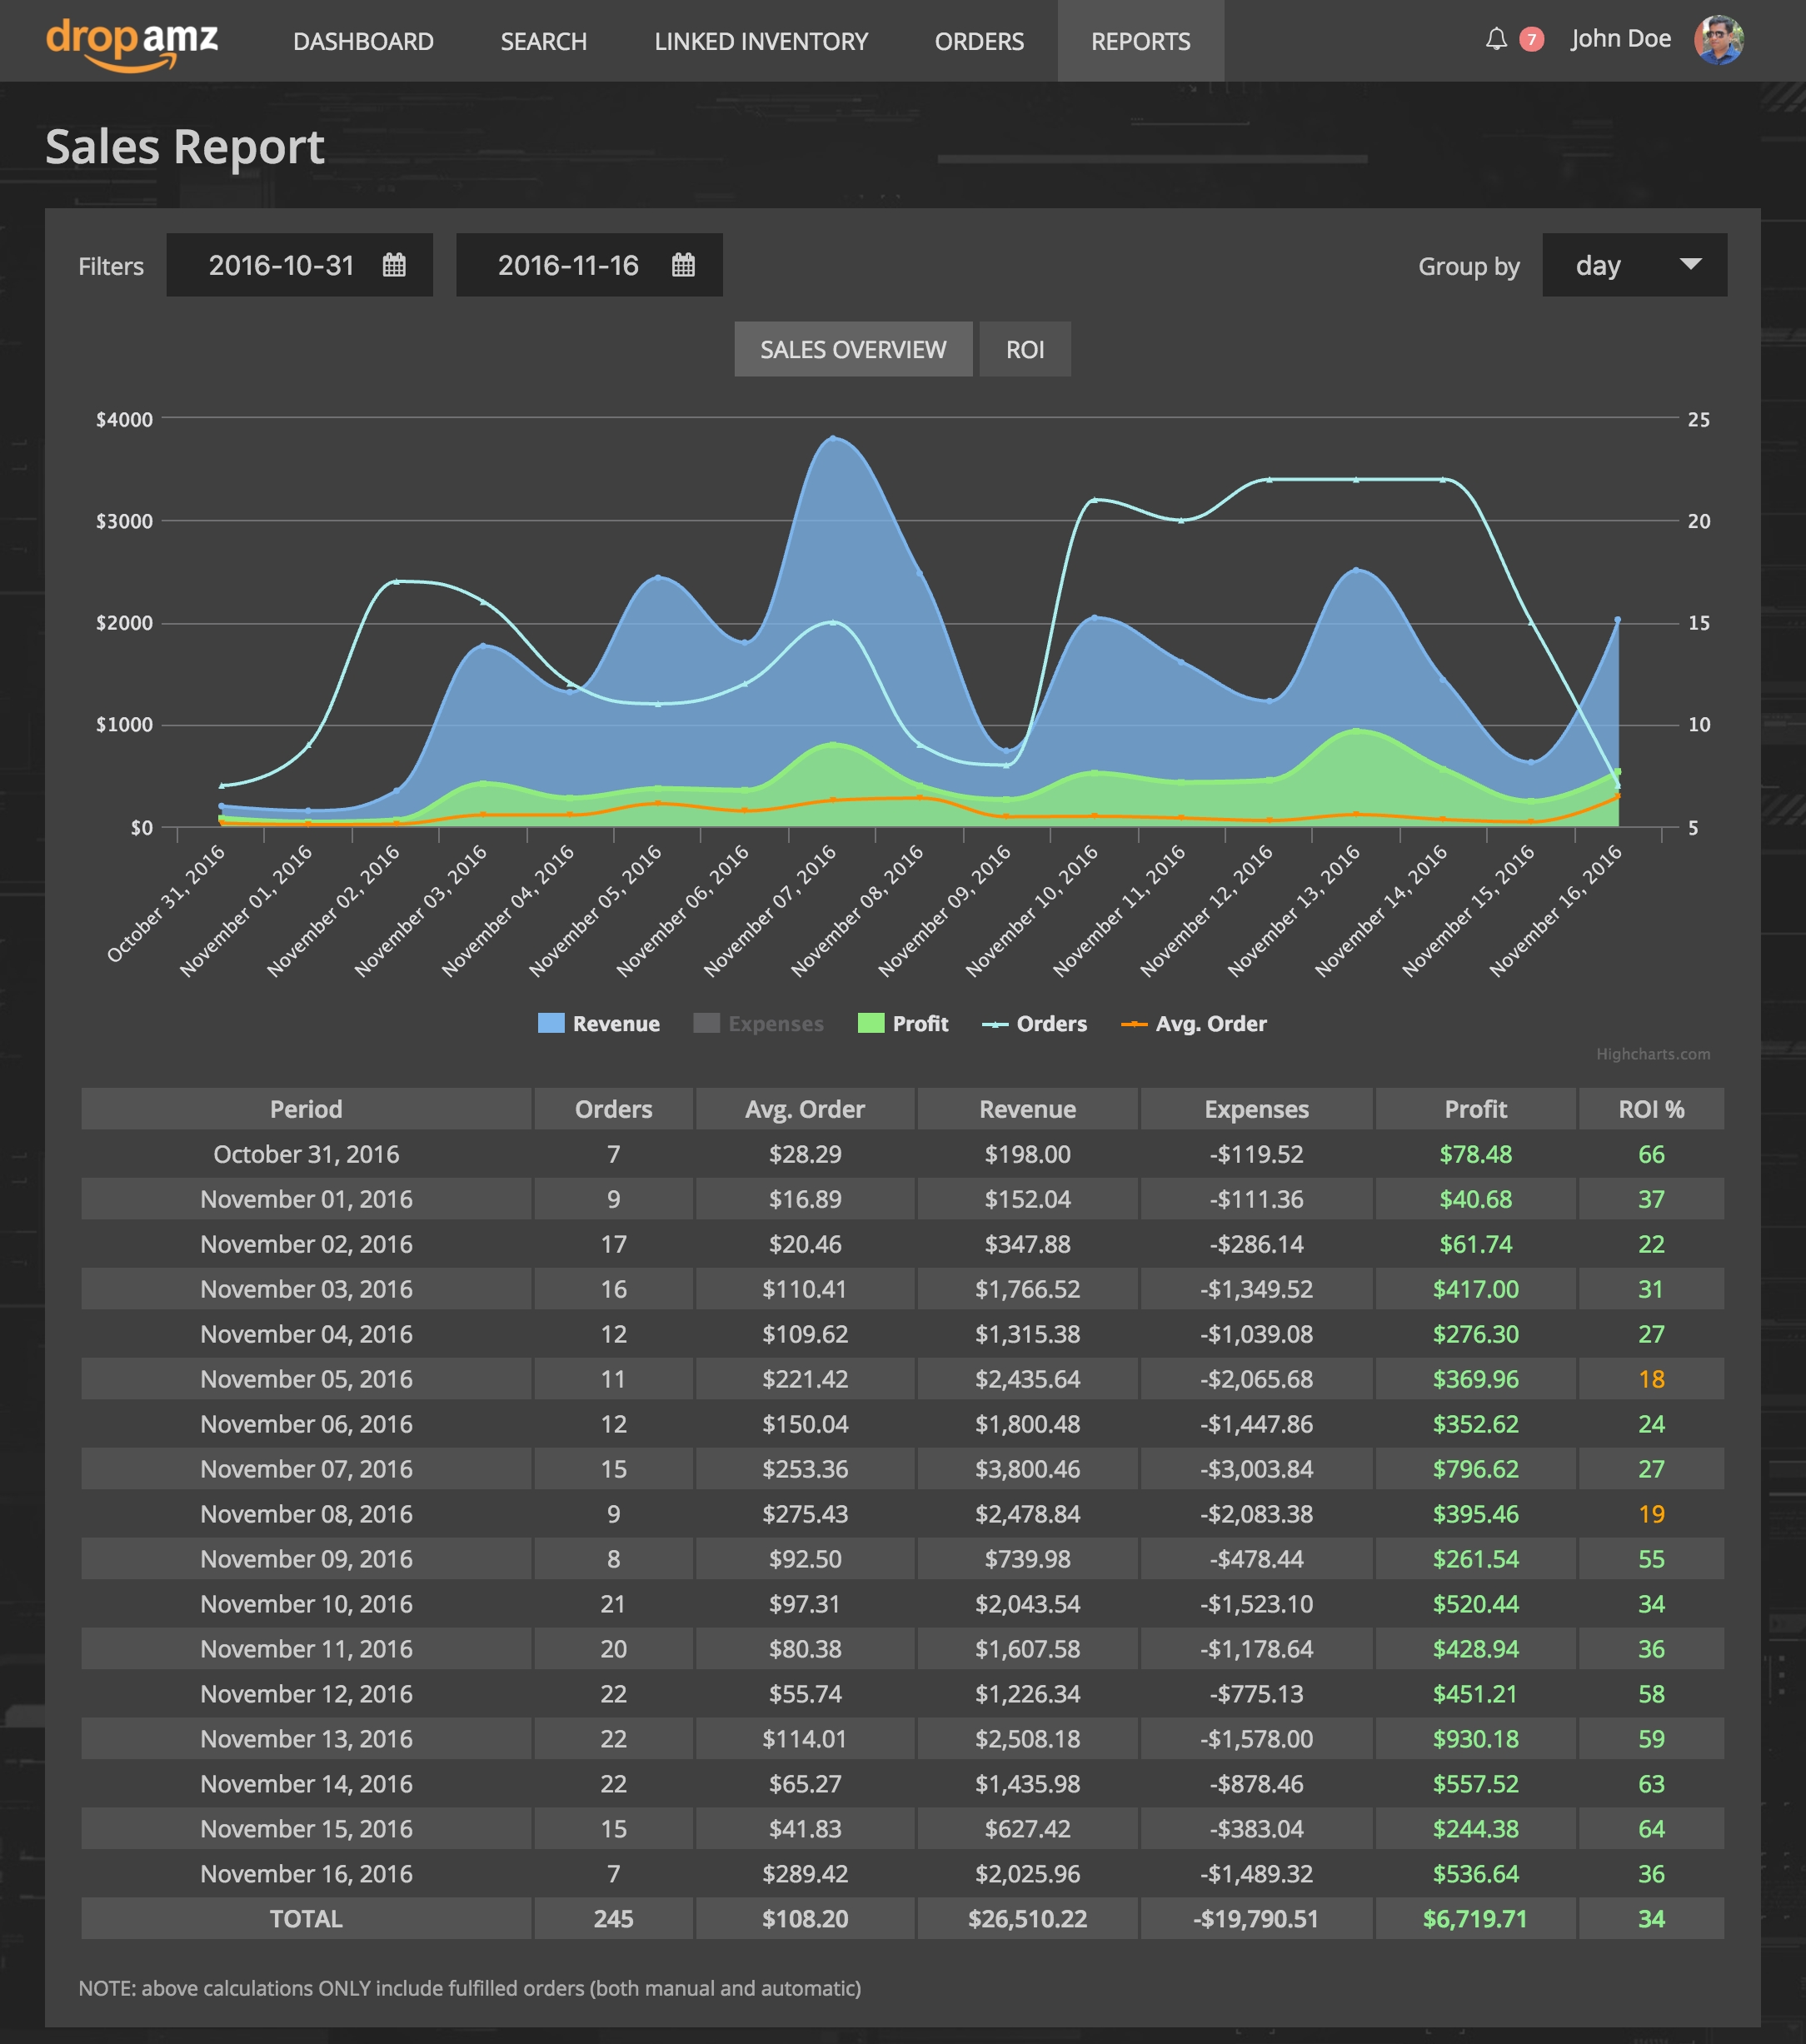
The report is pretty self-explanatory. Under the graph you can find the detailed table:
- Period – you can switch reporting period between day, week, month or year using the switch on the top right
- Orders – number of orders for the period
- Avg. Order – average order value for the period
- Revenue – total revenue for the period (Amazon 15% fee already deducted)
- Expenses – total expenses paid for fulfilling the orders
- Profit = Revenue – Expenses
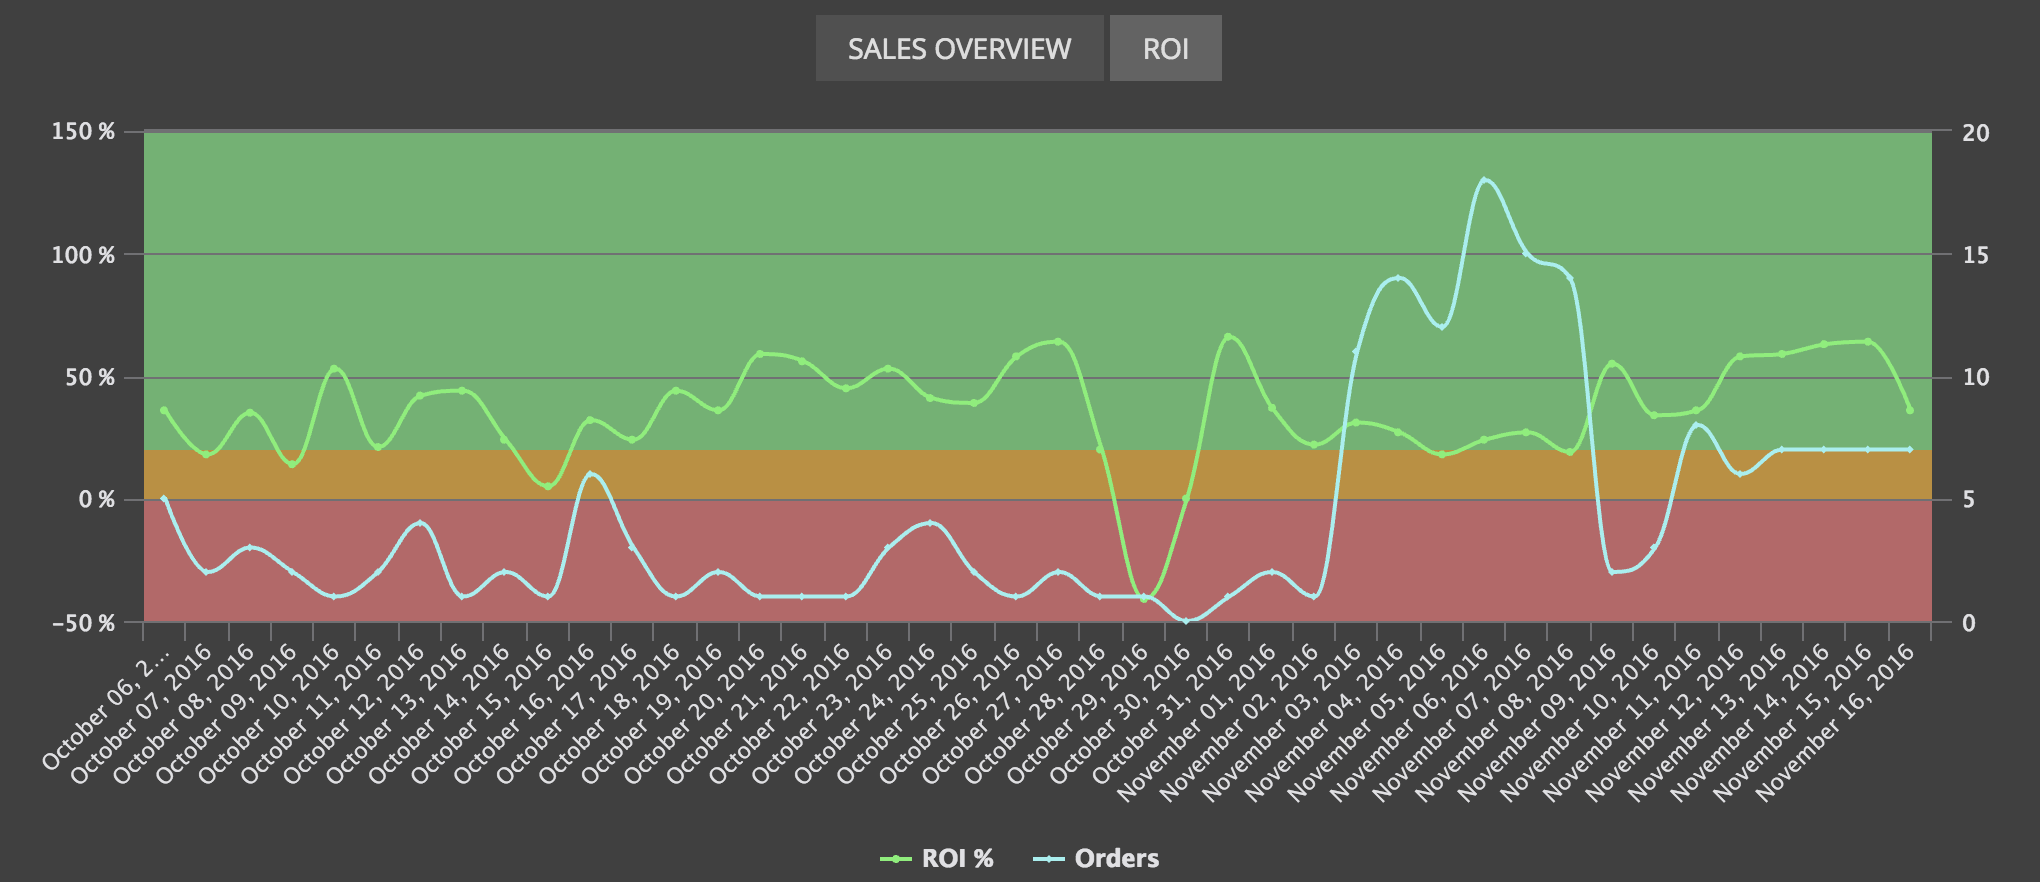
- ROI = Profit / Expenses
The report only accounts fulfilled orders and skips Cancelled and Not Back-Ordered Yet orders
Using the tabs above the graph you can switch between these 2 graphs:
- Sales Overview – quantitive sales performance visualization
- ROI – qualitative sales performance visualization: