Amazon Traffic statistics shows you how many potential buyers view your offers on Amazon. Essentially this is retrieved from your Amazon Seller Central / Business Reports section. The statistics is several places in the system – Reports section, Inventory Links list and individual inventory link view.
In order to receive, view and analyze these reports you have to Configure Amazon Traffic Statistics Collection
Amazon Traffic Report
You can reach the Amazon Traffic report by clicking Reports > Amazon Traffic from your drop2amz account. The report is pretty self-explanatory:

You can change the reporting period using the date fields in Filter area above the chart. You can also change the reporting period (day / week / month / year)
The report contains:
- New Links – number of new inventory links added during that period (day / week / month / year)
- Total Traffic – number of visitors viewed your offers for that period
- Buy Box Traffic – number of visitors viewed your offers in the Buy Box for that period
- Buy Box % – percentage of Buy Box views on that period
- Total Offers – number of unique offers viewed during that period
- Orders – number of orders during that period
- Conversion – percentage of how many views converted to orders (Orders / Total Traffic)
You can also switch between 3 charts:
- Traffic & Offers
- Traffic & Orders
- Conversion
Inventory Link Traffic Stats
Another spot where you can see the traffic statistics is individual inventory link view:
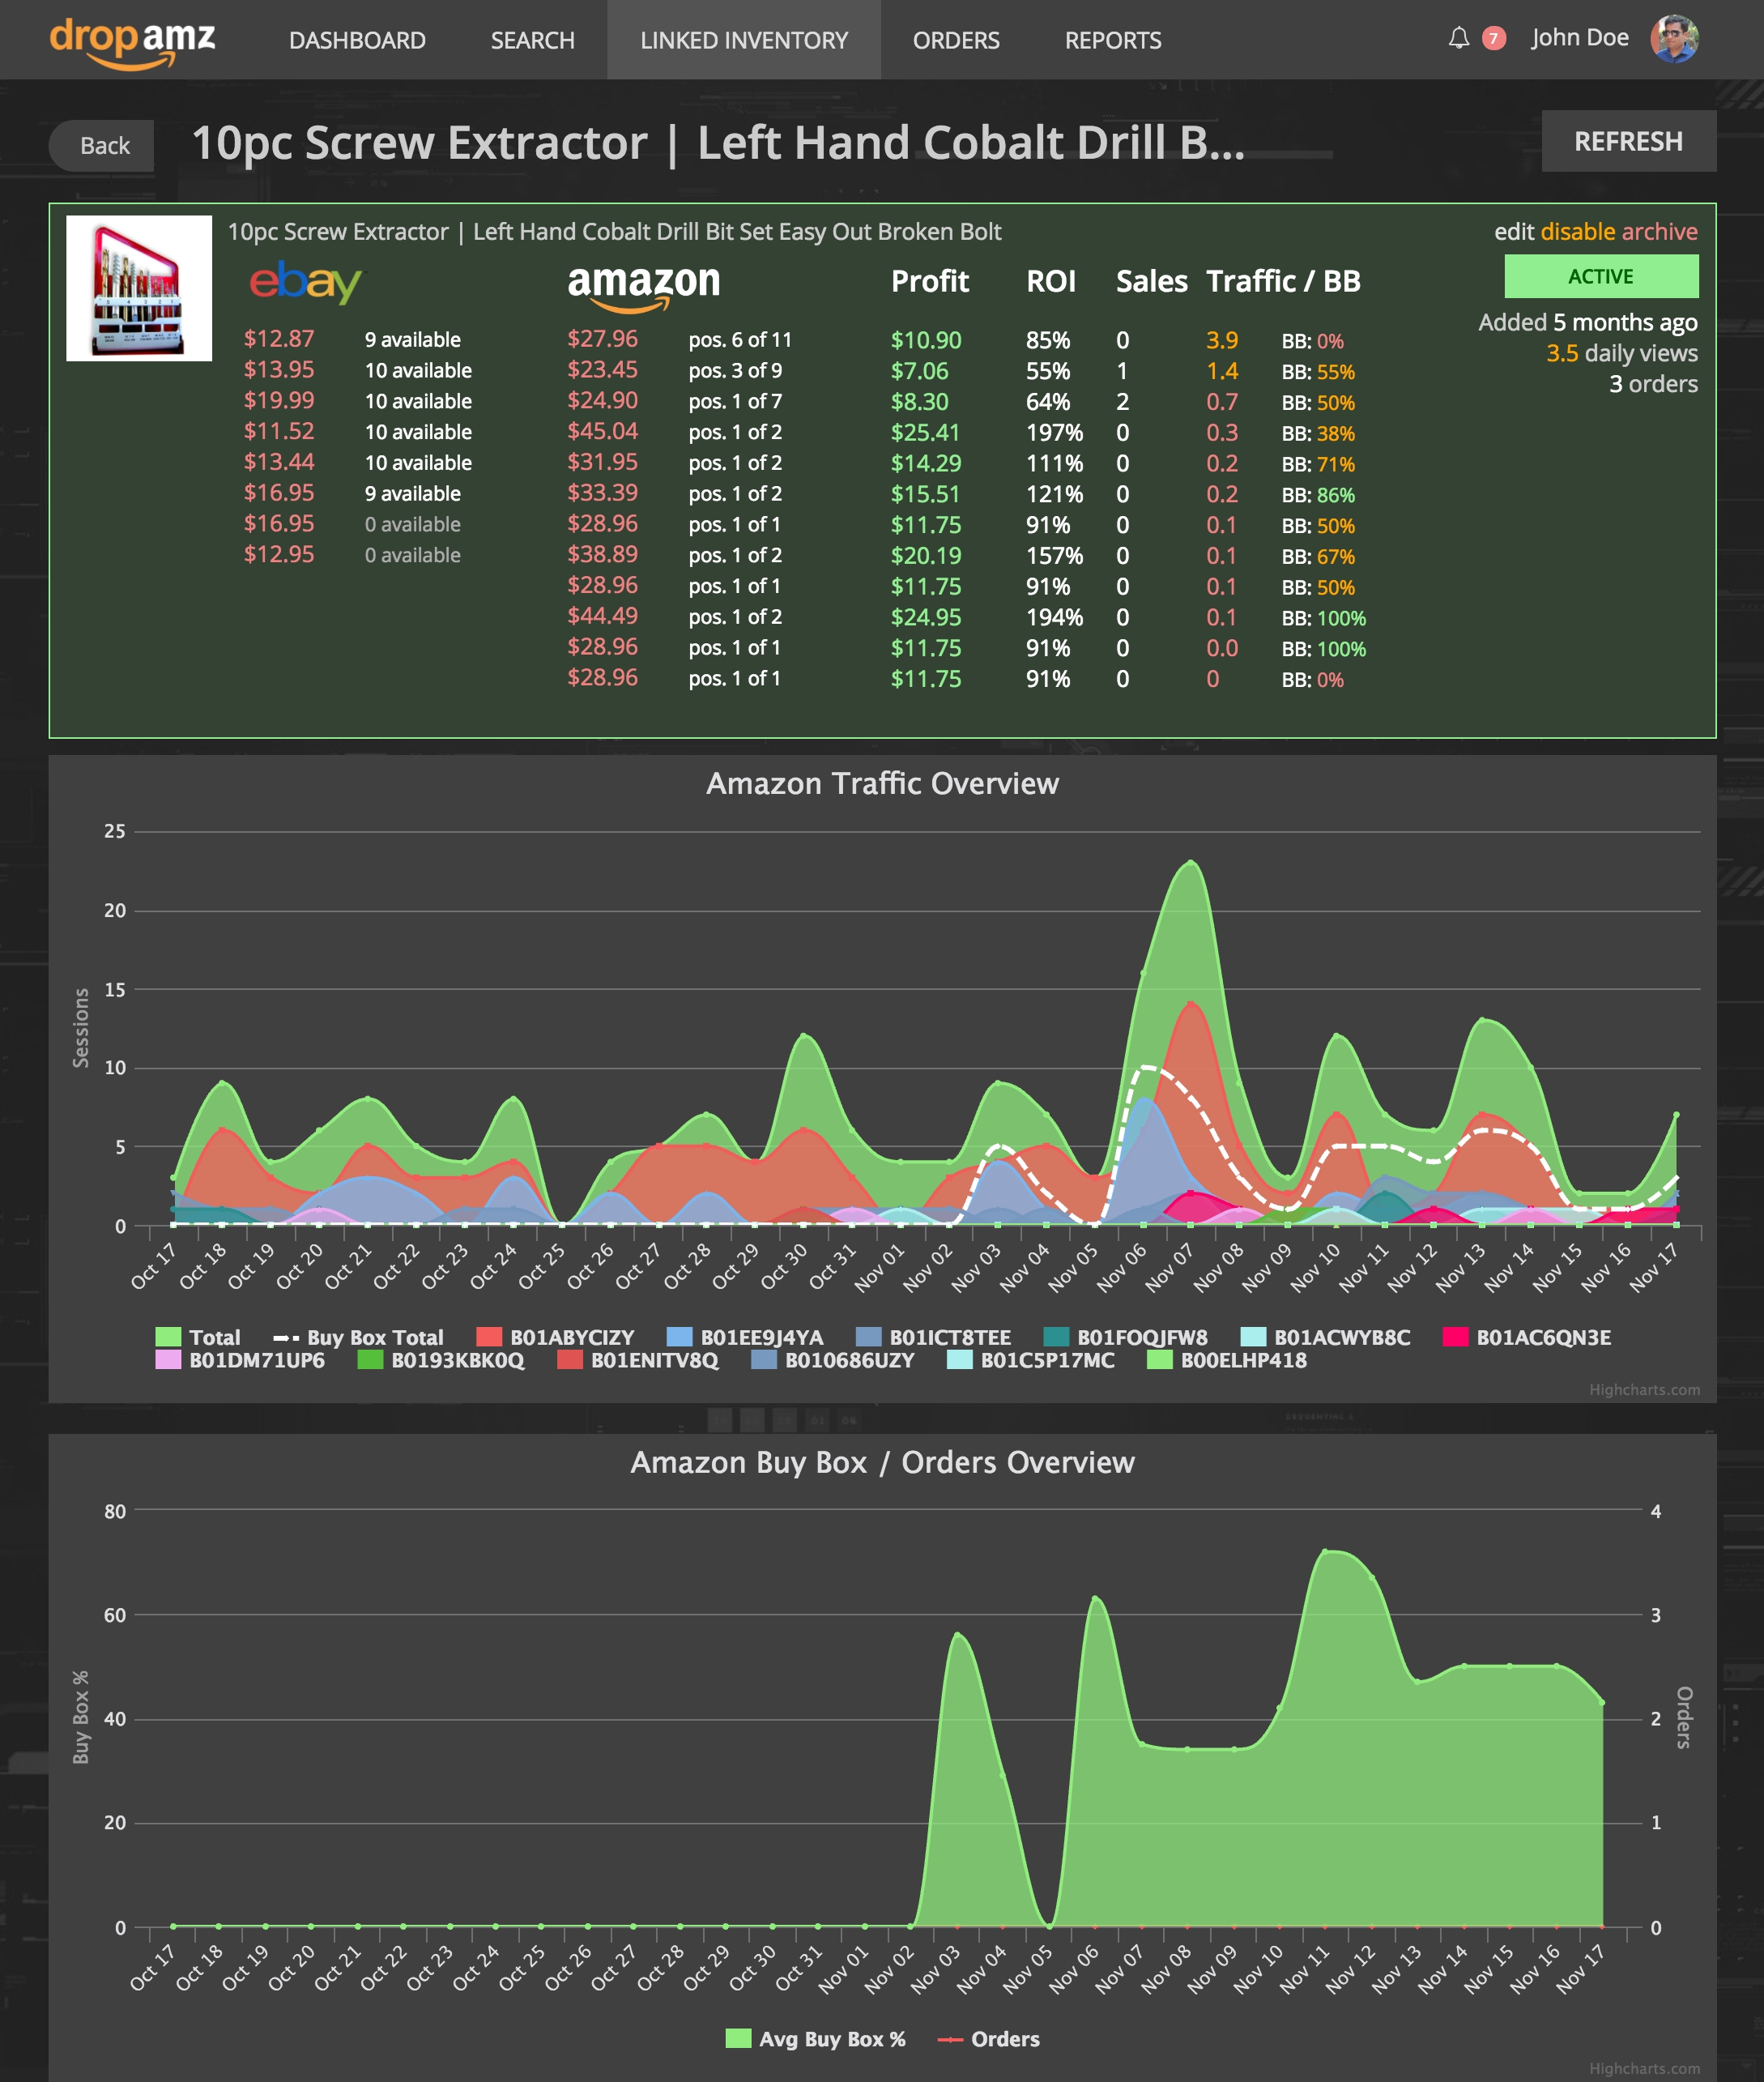
BB means Buy Box here and everywhere else in drop2amz
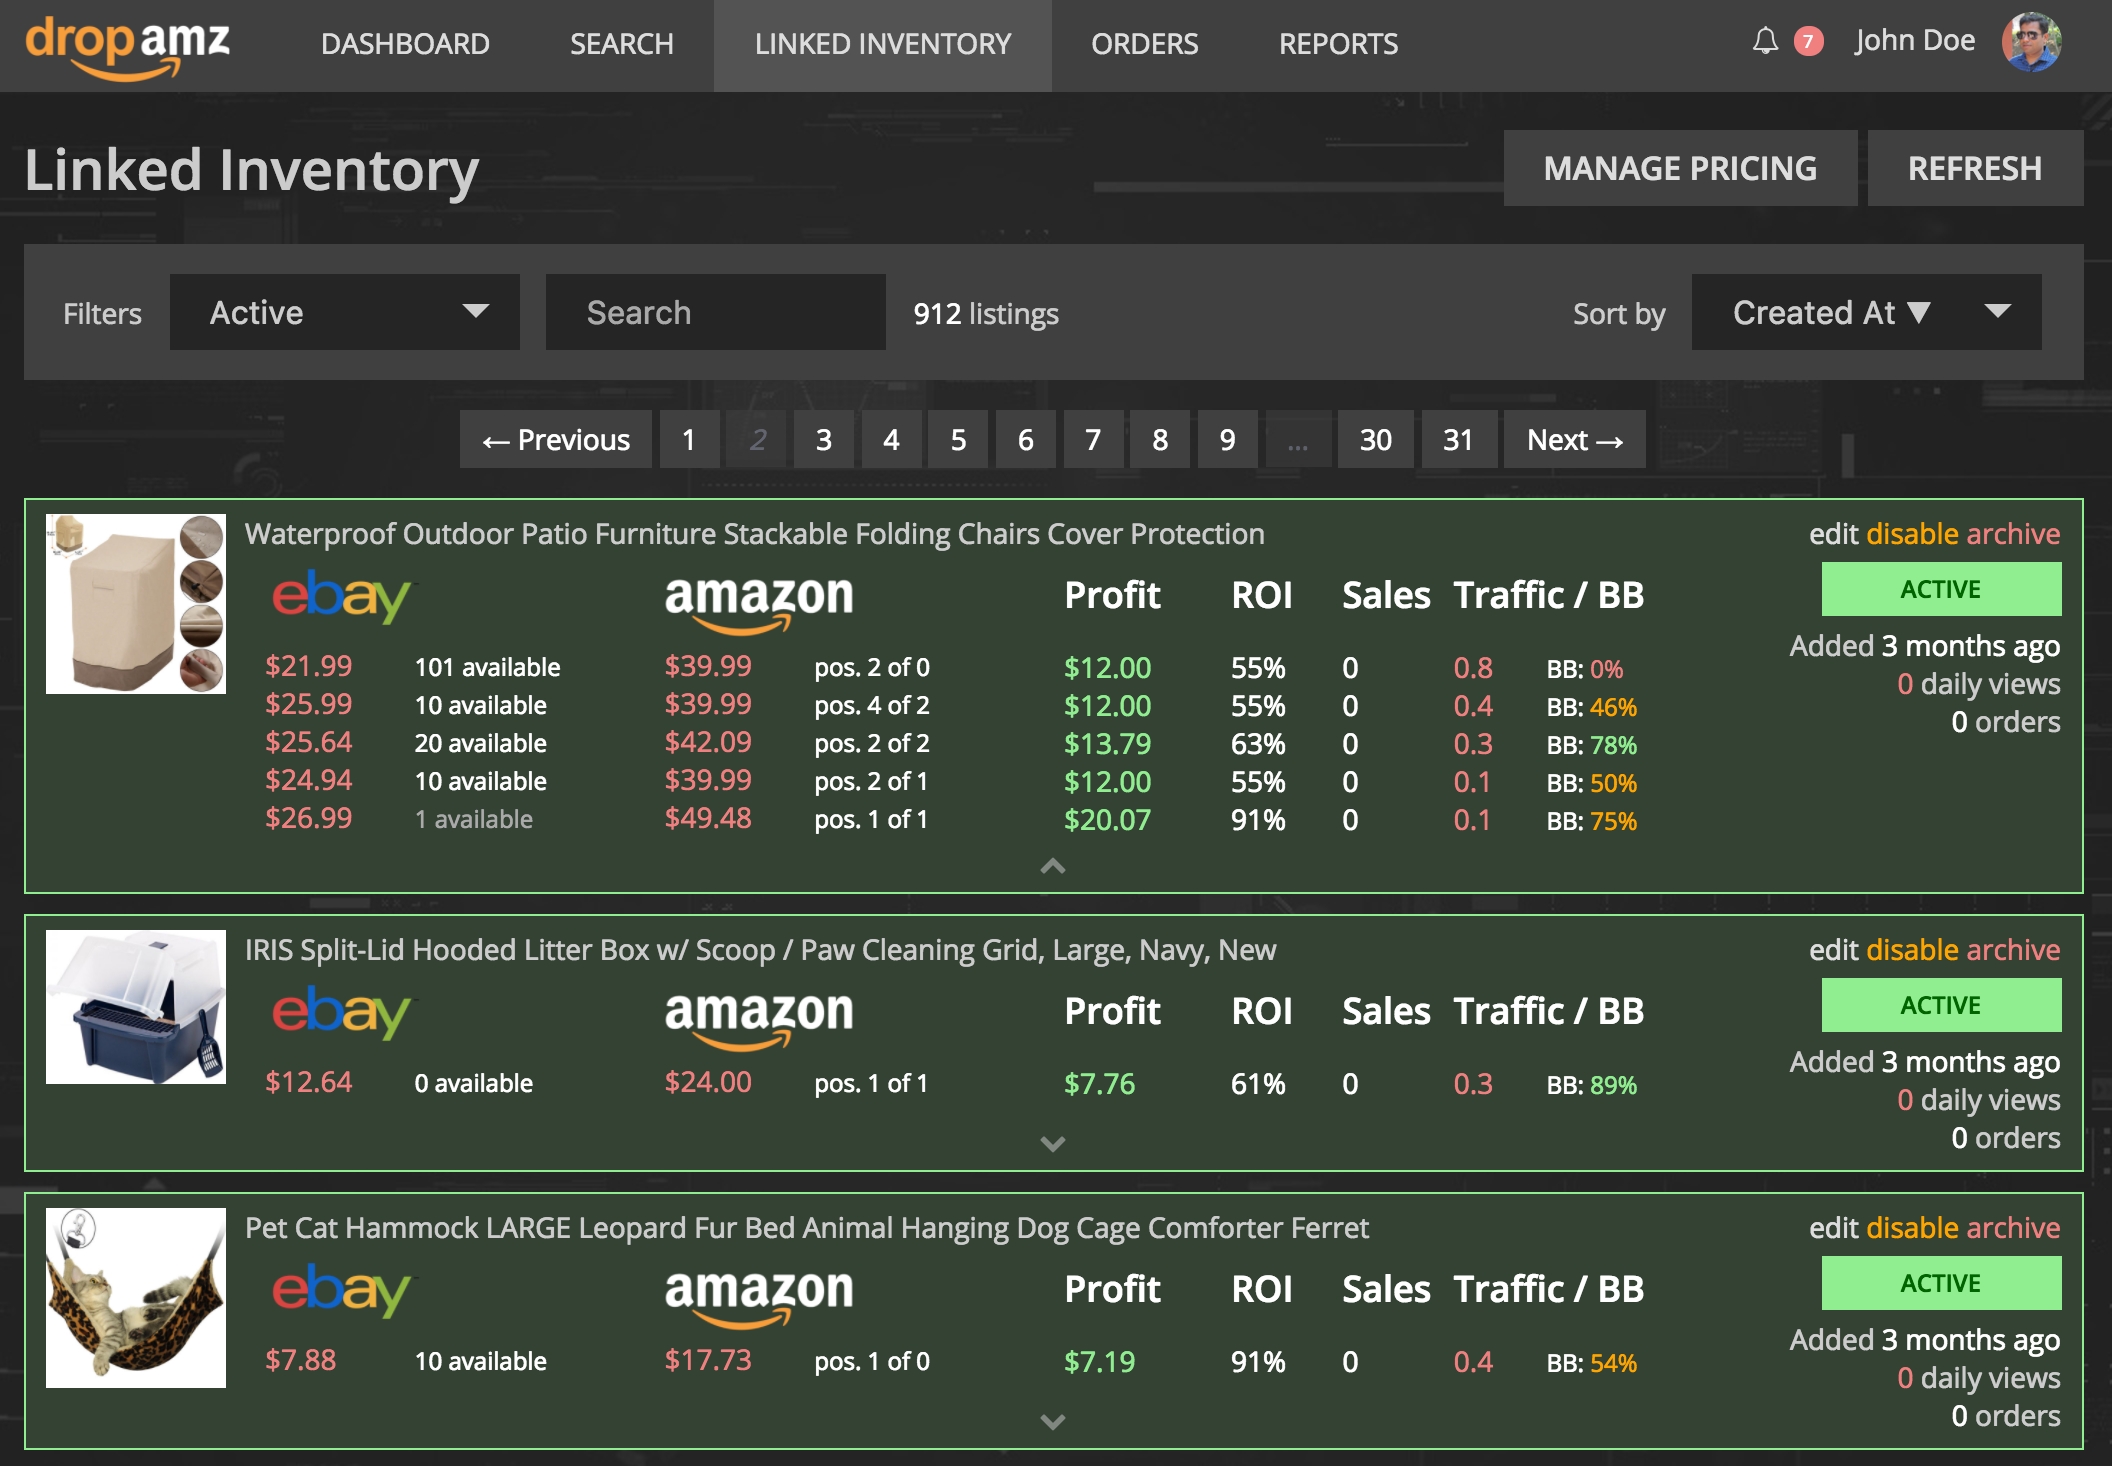
Inventory Link List Stats
Lastly, you can observe some traffic stats excerpts on your Inventory Link list: